Very few training covers in-depth SSAS in practical. Here in this write-up we will discuss one SSAS feature called KPI and which is also covered as training syllabus during MSBI training in Mumbai. KPI is known as Key Performance Indicators. It is a very important concept in SSAS. KPI helps in determining or defining and measuring the progress of a business goal or an activity.
Now usually in a business we set some target or a goal which has to be achieved and we also want to know that how are we performing in reaching that target. We want some indicators which tell us the status of our target and the performance. And that’s where the role of KPI comes into picture. With KPI we can do all the things like knowing the status of our progress, our performance in reaching the goal, etc.
As the name itself says KPI is a performance indicator.
Steps involved in creating a KPI:
Step 1: We have to open our cube package and then select the KPI option given on the top with all the other options like Process, Browser, etc.
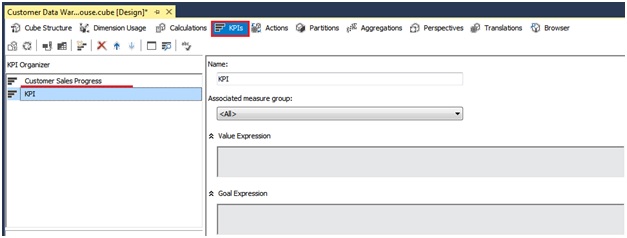
Step 2: Give a name to the KPI and select the associated measure group on which we have to do the KPI process.
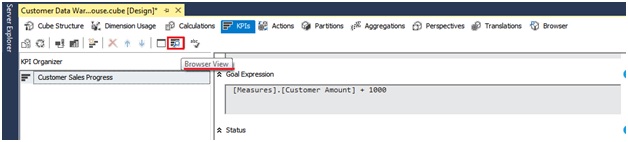
Step 3: Now in the boxes named “Value Expression”, “Goal Expression” we have to put the fact or the measure value. Here our Fact or measure is Customer Amount. So we will drag and drop the Customer Amount fact and put it in the boxes.

Now as we see in the above image the Goal Expression value is a bit different because we are setting a target or goal. Here the goal is the current Customer Amount plus 1000.
Step 4: Now we have to write the Status Expression. In the expression we have to mention that if the status of our current progress is good bad or ok. To do that we use numbers like “1,-1,0” where 1 means good, -1 means bad and 0 means ok.
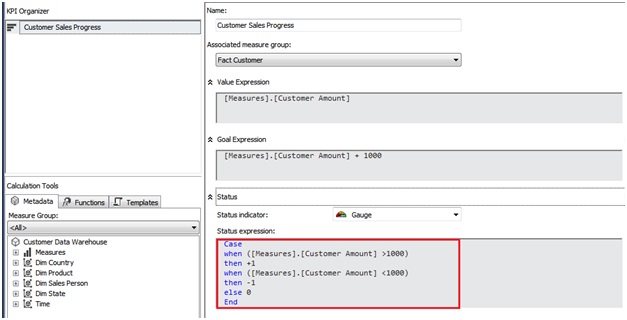
The expression is,
Case
when ([Measures].[Customer Amount] >1000)
then +1
when ([Measures].[Customer Amount] <1000)
then -1
else 0
End
Step 5: After setting the status we will now set the Trend. Trend means that what is the status of our previous value compared to current value. If it is good then then it is upward trend and if it is bad then it is downward trend. Here also we indicate the trend with numbers 1,-1, 0. If the previous value is less than the current value then we indicate it as 1 and if the previous value is greater the current value then we indicates it as -1. For ok we indicate 0.
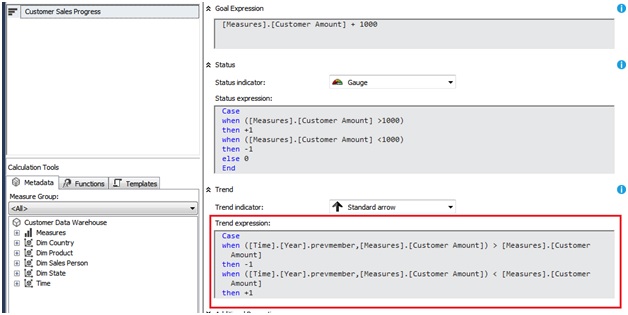
The expression is,
Case
when ([Time].[Year].prevmember,[Measures].[Customer Amount]) > [Measures].[Customer Amount]
then -1
when ([Time].[Year].prevmember,[Measures].[Customer Amount]) < [Measures].[Customer Amount]
then +1
else 0
End
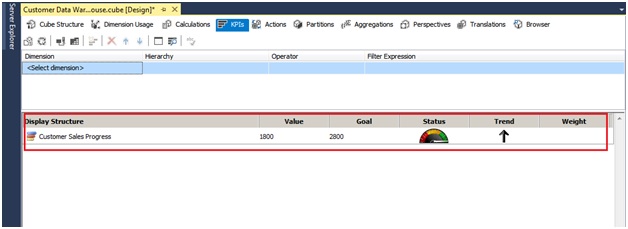
Step 6: After finishing all the steps save the KPI and then to view the KPI result there is option available where we can see the status and the progress of our goal. There is a Form View where we are doing our KPI process and there is a Browser View where we can see the progress status of our goal.
This is how our Browser View looks like,
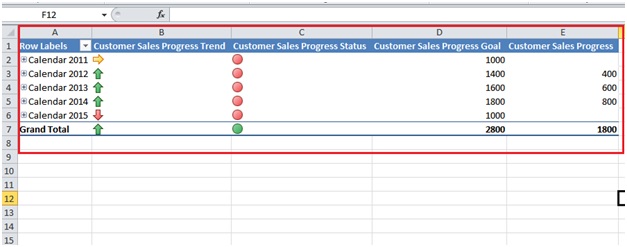
For end user this KPI report can be better viewed in Microsoft Excel.
SSAS provides a combined view of the data used in OLAP or Data mining. SSAS helps in creating, designing and managing multi-dimensional structures containing data from different sources. SSAS uses MDX queries and how to write MDX query is also covered in MSBI Mumbai training. SSAS has a wide array of data mining algorithms for specific trends and can be used as required.