
A histogram diagram represents an accurate visual representation of the distributed data of numerical format.
It is used to estimate of the probability distribution of a continuous variable also known as quantitative variable also it was first introduced by Karl Pearson.
The first step is to “bin” the range of values i.e. to divide the entire range of values into a series of intervals and then count how many values fall into each interval.
A variable of a bins are usually specified as consecutive, non-overlapping intervals.
The intervals of bin must be adjacent and are mostly but are not always required to be of equal size.
If the bins are of equal size a rectangle is created over the bin with a height equal to the frequency the number of cases in each bin. Relative frequencies can be displayed by normalizing histogram. Then it shows a graph the proportion of cases that fall into several categories of each with the sum of the heights equalling 1.
To create and run our R program in Visual Studio we must first install some tools.
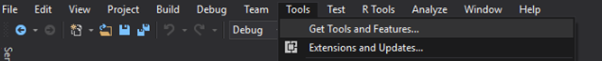
Now open Visual Studio on your pc and then click on Get Tools and features… inside Tools.
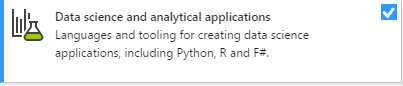
Now in the feature installation window check and install the following features.
For Visual Studio 2017
Contains Tools for Data Science
After this please install R tools from the following link if the above package is not installed properly from the following link
But it is not necessary
https://docs.microsoft.com/en-us/visualstudio/rtvs/installing-r-tools-for-visual-studio
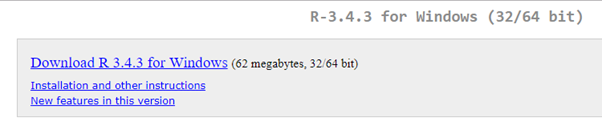
You can also install R programming tool go to the following link for better support and download the software and install it
For Windows Users:
For Linux Users:
If you are on Linux platform then you can use this fast and easy command used in Linux which can be used to install R. The yum command is used for installing like this:
$ yum install R
For Ubuntu Linux or other Debian-related OSs, a more direct method is:
$ apt-get install r-base
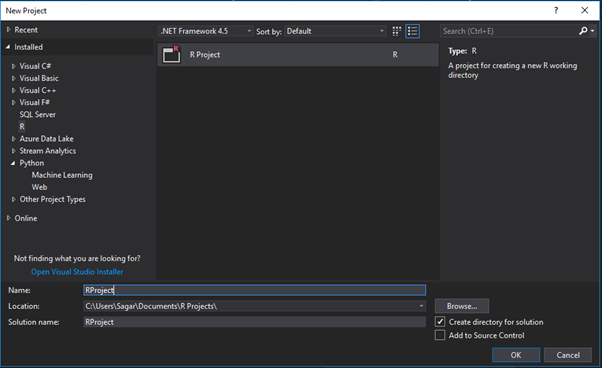
Now let us start creating our R application in visual studio
Go to Files ->Project and add a new R project
This is our project structure:
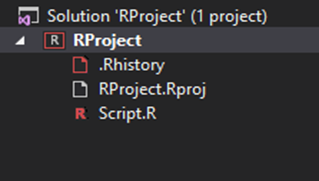
Now on the top left side is a new R file (script.R) where we can edit source code with all of Visual Studio Ide editing features.
Also on the bottom left of Visual Studio is where you can find an R Interactive window in which you can interactively develop and test code.
We can directly use R Interactive without the need of opening any new project.
The hist () function is used to create Histogram in R. Syntax
The following represents basic syntax for histogram
hist(v,main,xlab,xlim,ylim,breaks,col,border)
Where
- v :It is a vector containing numeric values used in histogram.
- main : It indicates title of the chart.
- col :It is used to set colour of the bars.
- border :It is used to set border colour of each bar.
- xlab :It is used to give description of x-axis.
- xlim :It is used to specify the range of values on the x-axis.
- ylim :It is used to specify the range of values on the y-axis.
- breaks :It is used to represent the width of each bar.
Following are two simple examples of Histogram in R programming:
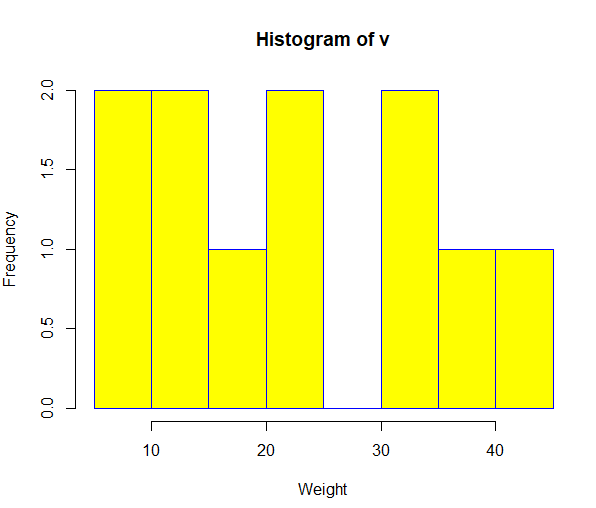
Example 1:
# Create data for the graph.
v <- c(9,13,21,8,36,22,12,41,31,33,19)
# Create the histogram.
hist(v,xlab = “Weight”,col = “yellow”,border = “blue”)
# Give the chart file a name.
png(file = “histogram.png”)
# Save the file.
dev.off()
Output:
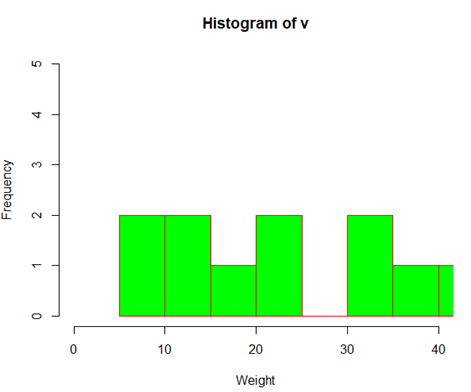
Example 2:
# Create data for the graph.
v <- c(9,13,21,8,36,22,12,41,31,33,19)
# Create the histogram.
hist(v,xlab = “Weight”,col = “green”,border = “red”, xlim = c(0,40), ylim = c(0,5),
breaks = 5)
# Give the chart file a name.
png(file = “histogram_lim_breaks.png”)
dev.copy(pdf,”myplot.pdf”, width=4, height=4)
getwd()
# Save the file.
dev.off()
Output:
Syllabus of Data Science training in Mumbai