
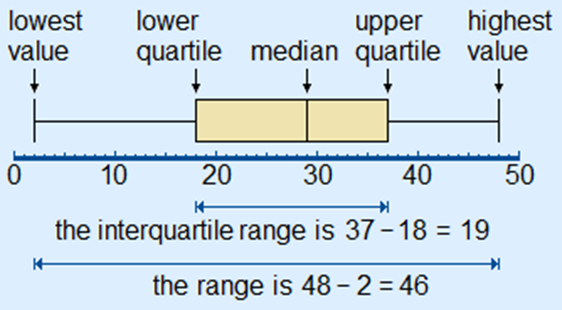
Box Plot is a simple way of representing statistical data on a graph or plot in which a rectangle is drawn to represent the second and third quartiles which usually has a vertical line inside the rectangle to indicate the median value.
In the Box Plot the lower and upper quartiles are shown as horizontal lines in either side of the rectangle.
Boxplots are used to measure of how well distributed is the data in a data set also box plot divides the data set into three quartiles each.
The minimum, maximum, median, first quartile and third quartile in the data set is represented in this graph.
By drawing boxplots for each dataset we can compare the distribution of data across these data sets.
The boxplot() function is used to create Boxplots in R.
For plotting a boxplot function in R we use the following function:
boxplot(x, data, notch, varwidth, names, main)
Where
- x : It is either a vector or a formula.
- data : It represents the data frame.
- notch : It is a logical value and it is set as TRUE to draw a notch.
- varwidth : It is a logical value also it is set as true to draw width of the box proportionate to the sample size.
- names : They are the group labels which will be printed under each boxplot.
- main : It is used to give a title to the graph.
To create and run our R program in Visual Studio we must first install some tools
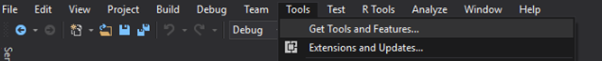
Now open Visual Studio on your pc and then click on Get Tools and features… inside Tools.
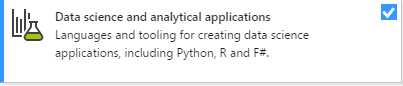
Now in the feature installation window check and install the following features.
For Visual Studio 2017
Contains Tools for Data Science
After this please install R tools from the following link if the above package is not installed properly from the following link
But it is not necessary
https://docs.microsoft.com/en-us/visualstudio/rtvs/installing-r-tools-for-visual-studio
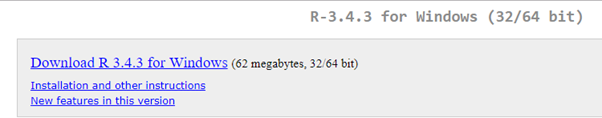
You can also install R programming tool go to the following link for better support and download the software and install it.
For Windows Users:
And in either Visual Studio R Interactive or RGui type and install.
install.packages(“plotrix”)
For Linux Users:
If you are on Linux platform then you can use this fast and easy command used in Linux which can be used to install R. The yum command is used for installing like this:
$ yum install R
For Ubuntu Linux or other Debian-related OSs, a more direct method is:
$ apt-get install r-base
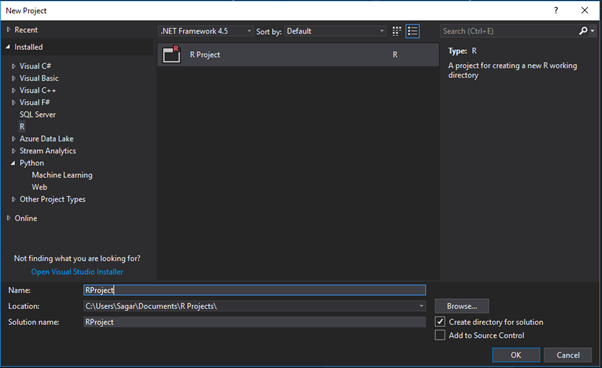
Now let us start creating our R application in visual studio
Go to Files ->Project and add a new R project
This is our project structure:
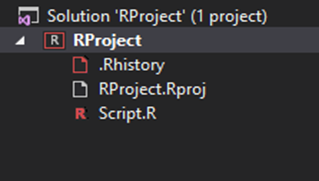
Now on the top left side is a new R file (script.R) where we can edit source code with all of Visual Studio Ide editing features.
Also on the bottom left of Visual Studio is where you can find an R Interactive window in which you can interactively develop and test code.
We can directly use R Interactive without the need of opening any new project.
The following is a Simple example for Box Plot Diagram which either be performed in RGui or Visual Studio:
#inserting the data into the dataframe
A <- c(3, 2, 5, 6, 4, 8, 1, 2, 3, 2, 4)
boxplot(A)
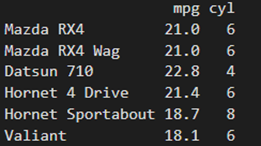
input <- mtcars[,c('mpg','cyl')]
print(head(input))
Output:
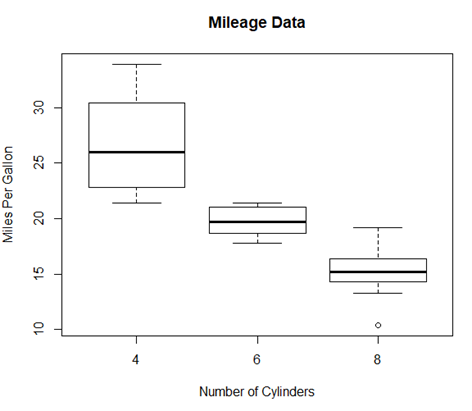
# Plot the chart.
boxplot(mpg ~ cyl, data = mtcars, xlab = “Number of Cylinders”,
ylab = “Miles Per Gallon”, main = “Mileage Data”)
# Give the chart file a name.
png(file = “boxplot.png”)
# Save the file.
dev.off()
Output:
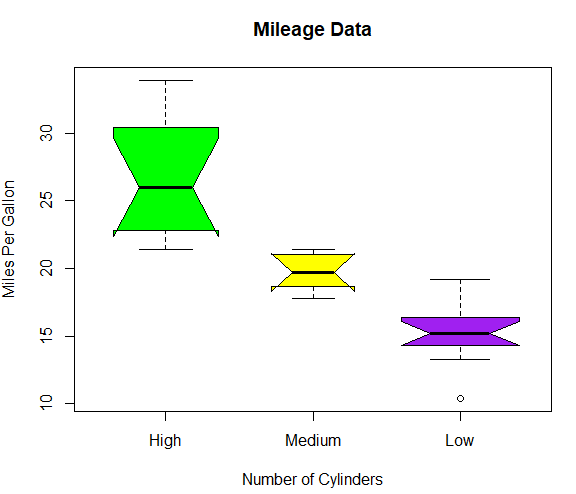
Boxplot with Notch
In the below example we can draw boxplot with notch to find out how the medians of different data groups match with each other.
# Plot the chart.
boxplot(mpg ~ cyl, data = mtcars,
xlab = “Number of Cylinders”,
ylab = “Miles Per Gallon”,
main = “Mileage Data”,
notch = TRUE,
varwidth = TRUE,
col = c(“green”,”yellow”,”purple”),
names = c(“High”,”Medium”,”Low”)
)
png(file = “boxplot_with_notch.png”)
# Save the file.
dev.off()
Output:
Syllabus of Data Science training in Mumbai