
Poisson regression in statistics is a generalized linear model which forms of regression analysis used to model count data and contingency tables.
The response variable Y being a Poisson distribution is assumed by Poisson regression hence assumes the logarithm of its expected value can be modelled by a general linear combination with unknown parameters.
The Poisson regression model which may sometimes also be known as a log-linear model and specially when it is used to model contingency tables.
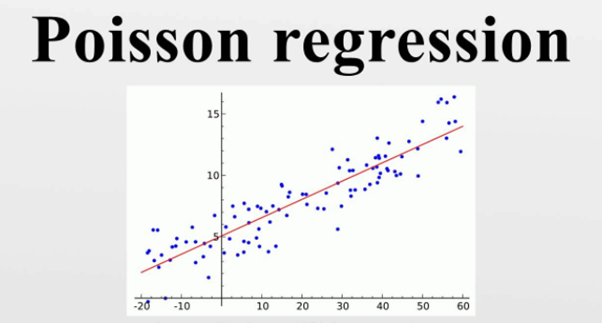
The Poisson Regression in mathematics involves regression models in which the response variable is in the form of counts but not fractional numbers.
For a simple example we can count the number of births or number of wins in a cricket or any other game series.
The equation for Poisson regression in mathematics can be given as:
log(y) = a + b1x1 + b2x2 + bnxn…..
Where
y :It is the response variable.
a ,b :They are the numeric coefficients.
x :It is the predictor variable.
The Poisson regression model is created using the glm() function.
The glm() function is the basic syntax for Poisson regression is −
glm(formula,data,family)

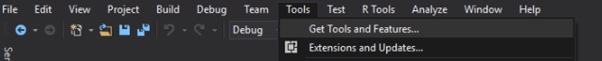
To create and run our R program in Visual Studio we must first install some tools.
Now open Visual Studio on your pc and then click on Get Tools and features… inside Tools.
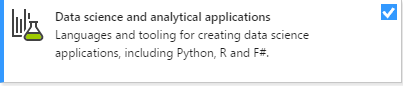
Now in the feature installation window check and install the following features
For Visual Studio 2017
Contains Tools for Data Science
After this please install R tools from the following link if the above package is not installed properly from the following link
But it is not necessary
https://docs.microsoft.com/en-us/visualstudio/rtvs/installing-r-tools-for-visual-studio
You can also install R programming tool go to the following link for better support and download the software and install it
For Windows Users:

For Linux Users:
If you are on Linux platform then you can use this fast and easy command used in Linux which can be used to install R. The yum command is used for installing like this:
$ yum install R
For Ubuntu Linux or other Debian-related OSs, a more direct method is:
$ apt-get install r-base
Now let us start creating our R application in visual studio
Go to Files ->Project and add a new R project
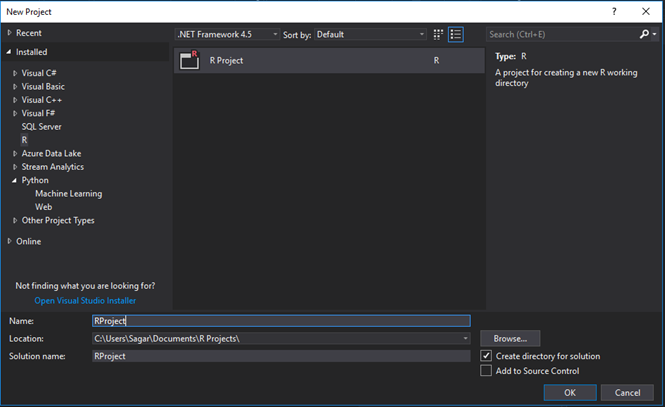
This is our project structure:

Now on the top left side is a new R file (script.R) where we can edit source code with all of Visual Studio Ide editing features.
Also on the bottom left of Visual Studio is where you can find an R Interactive window in which you can interactively develop and test code.
We can directly use R Interactive without the need of opening any new project.
Now let us see a demonstration of Poisson regression:
The pre-existing dataset “mtcars” describes different models of a car with their various engine specifications.
#Inserting data into the dataframe
input <- mtcars[,c("am","cyl","hp","wt")]
#Applying Poison Regression to the dataframe
am.data = glm(formula = am ~ cyl + hp + wt, data = input, family = binomial)
print(am.data)
print(summary(am.data))
Output:
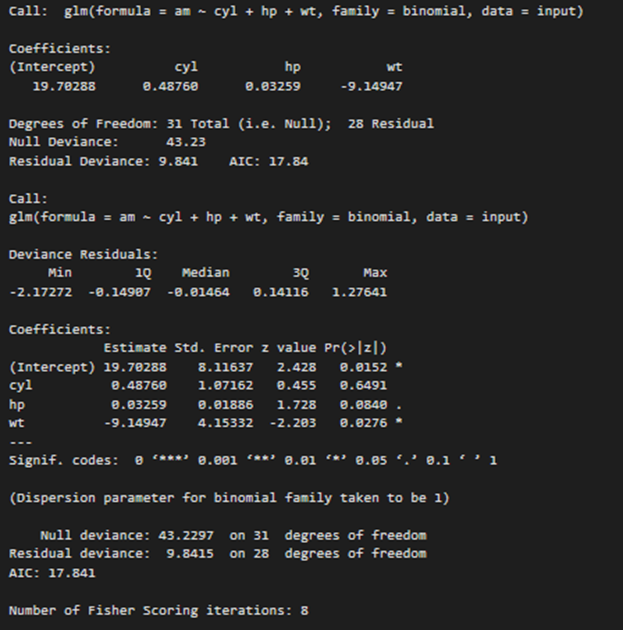
The p-value in the above output in the last column should be less than 0.05 to have any impact on the predictor variable of the response variable.
Syllabus of Data Science training in Mumbai